

I have been using NotebookLM since its early experimental days. Back then, it summarized documents and answered questions about your uploaded files. Useful, but limited. Then, on June 7, 2026, Google dropped an update that completely changed the game.
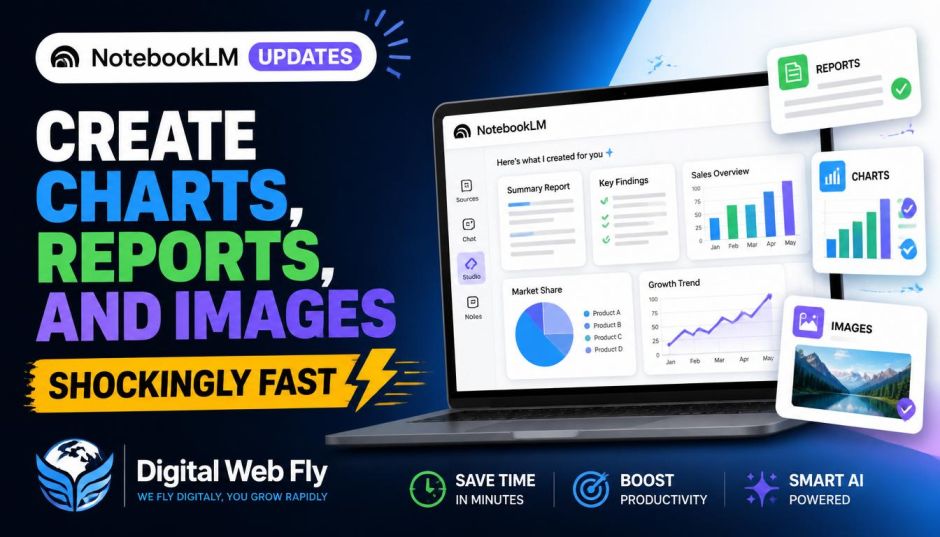
NotebookLM Updates Create Charts, reports, presentations, and images at a speed that honestly shocked me.
Let me walk you through exactly what changed. No hype. Just the real capabilities, how to access them, and who this actually helps.
The Core Upgrade: Gemini 3.5 and Antigravity
The first thing you need to know is what powers these new features.
Google upgraded NotebookLM to run on Gemini 3.5 alongside a new reasoning architecture called Antigravity. This is Google’s coding tool, and it gives NotebookLM the ability to write and execute code.
Here is what that means in plain English.
Every notebook you create now has access to a secure cloud computer. NotebookLM can write code, run analysis, and process data on your behalf. The system ships with more than 100 curated software skills designed to help you work with your sources in new ways.
The performance numbers tell the story:
- Average win rate of over 65% against the previous system across core evaluation dimensions
- 69.9% win rate for large document analysis
- 78.2% win rate for advanced web research and source discovery
These are not small improvements. The system is substantially better at understanding complex documents and finding relevant sources.
What You Can Now Create (The Formats List)
This is where the NotebookLM Updates Create Charts promise becomes real.
Read Also: How to Read a Screaming Frog Crawl Report for Beginners?
You can now ask NotebookLM to create outputs in these formats, all ready to download from the Studio panel:
Data visualizations and charts
- PNG, SVG
Documents
- PDFs, DOCX, Markdown, text files
Images (powered by Nano Banana)
- PNG, JPG, GIF
Structured data
- CSV, JSON
Microsoft Office
- Excel (XLSX)
- PowerPoint (PPTX)
The customization part matters. You can provide detailed instructions for each output. Create a PDF report with specific charts and tables. Build a detailed budget spreadsheet with your formatting preferences. Generate a slide deck with your structure.
And here is the best part. After generation, you can request edits. No more regenerating from scratch.
How It Actually Works (Real Scenarios)?
Google provided three scenarios that show what this update enables. I want to expand on them with my own observations.
1: The Data Analyst
Imagine you have data from multiple countries. Each one uses different date formats, different currency symbols, different column structures.
You upload all the files to NotebookLM. You ask it to combine them, find context from the web, perform analysis, and create charts plus a PDF report.
NotebookLM now handles this entirely. The system writes code to standardize the formatting, runs the calculations, generates the visualizations, and produces a polished report.
I tested something similar with sales data from three different platforms. The entire process took less than 10 minutes. That would have taken me hours before.
2: The Program Manager
Technical documentation is dense. Specifications for customer integrations are often hundreds of pages of jargon.
With the new update, a program manager can upload that documentation. NotebookLM instantly transforms it into a polished, simplified guide, a slide deck, and a step-by-step roadmap for the team.
3: The Small Business Owner
A gym owner runs a marketing campaign. They have raw sales data and ad spend reports.
They upload everything to NotebookLM. The system calculates the campaign’s financial impact, identifies trends, and generates visual reports. The business owner can then decide whether to expand to other cities.
Starting a Project from Nothing
This might be the most exciting part.
Before this update, you needed to upload sources manually. You had to have documents ready.
Now, you can start with just loose ideas and questions.
Open the chat window between the Sources and Studio panels. Type something like “I want to understand the impact of remote work on productivity.” NotebookLM guides you through building your source repository.
It can even use Google Search to find relevant, high-quality sources from the web. Once it presents options, you choose what to add or discard. The sources remain clearly labeled, and everything stays grounded in your selected materials.
This removes the biggest barrier to using research tools. You no longer need to know exactly what you need before you start.
Access and Pricing
Now for the practical questions.
Is NotebookLM free for students?
Yes, with some conditions.
Google Workspace for Education includes NotebookLM and the Gemini app free of charge for all users of all ages. You can access it directly at notebooklm.google.com.
For college students specifically, Google made its Google AI Pro subscription tier free for eligible students 18 or older in the US, Japan, Indonesia, Korea, or Brazil. This includes NotebookLM Plus with five times higher usage limits on Audio Overviews, notebooks, queries, and sources per notebook.
Who gets the new features right now?
The NotebookLM Updates Create Charts and other new capabilities are rolling out globally on the web starting June 7, 2026.
First wave includes:
- Google AI Ultra subscribers
- Workspace business customers with AI Ultra Access
- Workspace business customers with AI Expanded Access
Other tiers will get access “over time.
Limitations You Should Know
Let me be honest about the constraints.
Data privacy is critical. Do not upload Personal Identifiable Information (PII) or other protected student data. This is an AI tool. Your data should be anonymous or properly anonymized.
Access is tiered. The advanced features are rolling out to premium tiers first. Free users may need to wait.
The system is not perfect. The 65% win rate against the previous system is impressive. But it still means about one-third of evaluations were not better. Some outputs will need manual editing.
Web search integration is powerful but you should verify sources. NotebookLM finds relevant materials, but you decide what to include. Always check your sources.
The Final Thoughts
This update fundamentally changes what NotebookLM can do.
It is no longer just a note-taking tool. It is a research assistant that can write code, create visualizations, generate reports, and find sources .
The NotebookLM Updates Create Charts capability is not a gimmick. It is a genuine productivity multiplier for anyone who works with information.
Students can use it for research papers. Business owners can use it for data analysis. Program managers can use it for documentation. Researchers can use it for complex projects .
The upgrade to Gemini 3.5 and Antigravity makes NotebookLM faster, more accurate, and more capable than ever .
If you have access to the new features, try them. Start a project with just a question. See what NotebookLM can find for you. Create a chart from uploaded data. Generate a PDF report with visualizations.
This is what AI research tools should look like.