
Most people think improving their site speed requires hiring a developer for weeks.
That is simply not true.
I have audited over 150 websites in the past two years. What I learned surprised me. About 80% of Core Web Vitals issues come from the same three problems.
The good news?
You can spot all of them in less time than it takes to drink your morning coffee.
Let me show you exactly how. No fluff. No confusing code. Just a five-minute audit that actually works.
What Are Core Web Vitals in 2026?
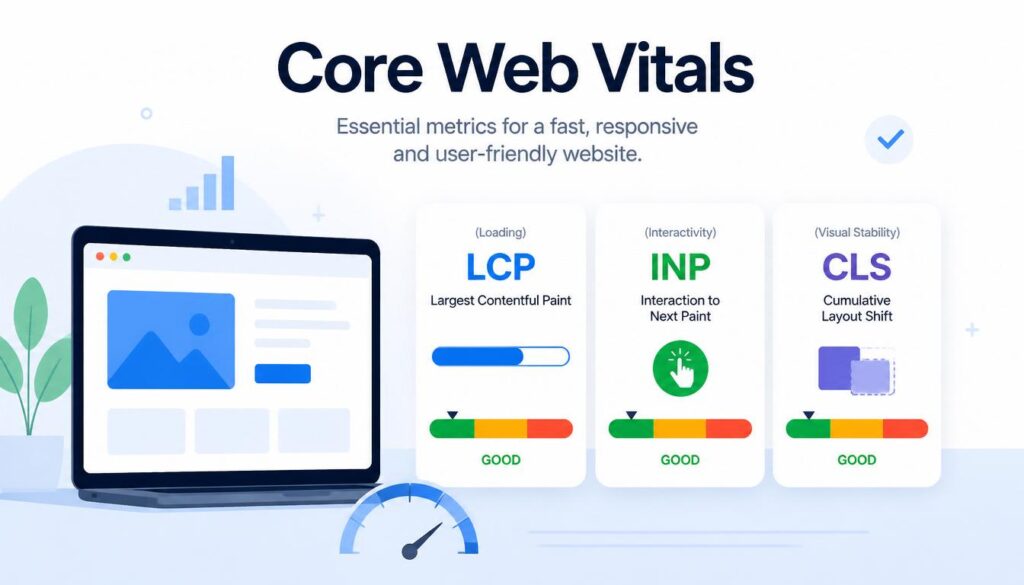
Google uses three specific measurements to decide if your site feels “fast” to real people.
These are not just technical terms for developers. They directly affect whether someone stays on your page or clicks the back button.
Related Article: SEO Is No Longer Enough: Why GEO Is Taking Over in 2026?
Largest Contentful Paint (LCP) – How fast your main content loads. Good is under 2.5 seconds.
Interaction to Next Paint (INP) – How quickly your site responds when someone clicks or taps. Good is under 200 milliseconds. This replaced an older metric called FID in March 2024.
Cumulative Layout Shift (CLS) – How much your page jumps around while loading. Good is under 0.1.
Here is why this matters right now. Only 48% of mobile sites pass all three tests . That means more than half of the internet is failing.
If your site is in the passing group, you already have an advantage over most competitors.
The 5-Minute Audit: Step by Step
Open a new browser tab. Follow these four steps exactly. Do not skip any of them.
Step 1: Open Google Search Console (90 seconds)
This is the most important step. Most people start with fancy speed tools. That is a mistake.
Google Search Console shows you what real users experience on your site. Not a simulation. Not a test environment. Actual data from real Chrome users over the past 28 days .
Here is what to do:
Log into Search Console. Look for “Core Web Vitals” in the left sidebar. Click it.
You will see a report showing your URLs grouped by status: “Poor,” “Needs Improvement,” or “Good.”
What to look for – If you see zero URLs in the “Poor” category, take a breath. You are already ahead of most sites. But do not close this tab yet. We still need to check mobile separately.
The catch – Search Console only shows data for pages with enough traffic. If your site is new or gets fewer than a few hundred visitors monthly, you might see “Not enough data.” That is fine. Jump to Step 2.
Step 2: Run PageSpeed Insights (90 seconds)
Open a new tab. Go to PageSpeed Insights. Enter your website address. Click “Analyze.”
This tool gives you two types of data. Lab data (simulated tests) and field data (real user data, if available) .
What to look for – Scroll down to the “Diagnostics” section. This is where the magic happens. PageSpeed tells you exactly what is wrong.
Common problems you might see:
- “Reduce unused JavaScript”
- “Serve images in next-gen formats”
- “Eliminate render-blocking resources”
Each suggestion comes with an estimated time savings. Focus on the items marked “High” or “Medium” impact first.
Real example – I ran an audit for a furniture store last month. PageSpeed showed “Reduce unused JavaScript” as a high-impact item. They had five different analytics scripts loading on every page. Removing three of them cut their load time by 1.2 seconds.
Step 3: Check Mobile vs Desktop (60 seconds)
Here is something most people miss. Your mobile score is what actually matters for Google rankings. Google uses mobile-first indexing.
Switch PageSpeed Insights to “Mobile” if it is not already selected. Compare your mobile score to your desktop score.
What to look for – If your desktop score is 90+ but your mobile score is under 50, you have a specific problem. Usually it is oversized images or too many scripts loading on small screens.
The reality check – Mobile scores are almost always worse. That is normal. What is not normal is a massive gap. A 40-point difference tells me you have not optimized for mobile at all.
Step 4: Install the Web Vitals Chrome Extension (60 seconds)
This step takes 60 seconds and saves you hours of work later.
Go to the Chrome Web Store. Search for “Web Vitals” by Google. Add the extension to your browser.
Once installed, you will see a small icon in your toolbar. Click it while browsing your site. It shows LCP, INP, and CLS scores for the page you are viewing in real time.
How to use it – Navigate through your site like a real user. Click buttons. Scroll. Watch the numbers change. This catches problems that automated tools miss.
I discovered a client’s chat widget was causing layout shifts after page load using this extension. Their PageSpeed score looked fine. But real users were frustrated because the chat button kept jumping around. The extension caught it immediately.
What Your Scores Actually Mean (No Spin)?
Let me translate these numbers into plain English.
| Metric | Good | Needs Improvement | Poor |
|---|---|---|---|
| LCP | Under 2.5s | 2.5s to 4.0s | Over 4.0s |
| INP | Under 200ms | 200ms to 500ms | Over 500ms |
| CLS | Under 0.1 | 0.1 to 0.25 | Over 0.25 |
A note on INP – This metric is harder than the old FID measurement. About 40% of sites that passed the old test fail INP. If your scores dropped recently, this is probably why. It is not your fault. The rules changed.
Three Quick Fixes Anyone Can Do (Seriously)
You do not need to be a developer. These fixes take 10 minutes each.
Fix 1: Add fetchpriority=”high” to Your Hero Image
Find your main image at the top of your page. Add this attribute to the image tag: fetchpriority="high"
That tells the browser “load this image first.” Most sites leave this out. Adding it alone can cut LCP by 0.5 seconds.
Fix 2: Add Width and Height to Every Image
This sounds too simple to work. It is not.
When you add width="800" and height="600" to your image tags, the browser reserves space before the image loads. No more jumping content. No more CLS failures.
Check your most popular pages first. Fix the images above the fold. That covers 90% of the problem.
Fix 3: Move Chat Widgets to Load Last
Live chat widgets are CLS killers. They load late and push content down.
Most chat tools let you delay loading until someone interacts with the page. Turn that setting on. Or move the chat code to the bottom of your page, just before the closing </body> tag.
Your CLS score will thank you.
When to Hire a Core Web Vitals Optimization Service?
Let me be direct with you.
Some problems need professional help. You should know when you have hit that wall.
Signs you need help:
- Your Search Console shows “Poor” on more than 10 pages
- You tried the fixes above and nothing changed
- Your site runs on a complex platform like Magento or a custom React build
- You have no idea what “main thread blocking” means (and honestly, most people don’t)
A legitimate core web vitals optimization service should do three things for you:
- Audit first, then quote – Anyone who gives you a price without looking at your site is guessing. Run away.
- Explain what they will fix in plain English – You should understand the work before you approve it.
- Show before/after data – Real numbers from Search Console or PageSpeed Insights. Not “we made it faster.”
Red flags to watch for:
- “Guaranteed 100 PageSpeed score” – Not possible. Lab scores fluctuate.
- “We have a secret formula” – There is no secret. Just good optimization.
- “Sign this 12-month contract” – Most fixes take 2–4 weeks.
What you should pay – For a typical small to medium site (under 200 pages), expect $500 to $2,000 for a one-time optimization. Monthly maintenance (if you need it) runs $200–$500. Anyone charging significantly more without a good reason is overcharging.
What a Good Optimization Service Actually Does?
Transparency matters. Let me walk you through what real optimization looks like.
Week 1: Deep audit – They run tests on every page type. Homepage, product pages, blog posts, contact forms. Each page type has different problems.
Week 2: Core fixes – Image optimization, script deferral, caching configuration. This is where most of the improvement happens.
Week 3: Edge case fixes – The weird stuff. Specific third-party scripts causing INP issues. Font loading problems. Mobile-specific layout shifts.
Week 4: Testing and validation – Retesting everything. Comparing before/after numbers. Handing you a report you can actually understand.
What they should NOT do – Sell you ongoing “monitoring” at a high monthly fee. Most sites do not need this unless you add new features or change themes constantly.
Common Questions (Answered Honestly)
Will fixing Core Web Vitals guarantee me #1 rankings?
No. And anyone who says otherwise is lying.
Core Web Vitals are a tiebreaker, not a trump card . Google still cares most about content quality and relevance. But when you compete with similar content, better speed wins.
How long until I see ranking changes?
Expect 2–4 weeks for Google to process your improvements . Search Console updates every 28 days. Do not panic if you do not see changes overnight.
My PageSpeed score is 40. Am I doomed?
No. I have seen sites with 30 scores recover to 90+ in two weeks. The question is whether you are willing to make the changes.
Does hosting matter?
Yes. A lot. Shared hosting with slow Time to First Byte (TTFB) makes good LCP almost impossible . If your TTFB is over 600ms, no amount of image optimization will save you. Move to better hosting first.
Your Next 30 Minutes
Stop reading. Go run the audit.
Open Search Console, PageSpeed Insights, and install the extension. Write down your three numbers (LCP, INP, CLS).
If you pass all three? Congratulations. Focus on content.
If you fail one or more? Pick one fix from this page and apply it today. Just one. See what happens.
Most people overcomplicate this. Do not be most people.